ggplot2 and Subway
20 April 2011
The following article caught my eye a few weeks ago: Subway Set to Overtake McD’s in Omnipresence. As I am trying to learn a little bit of ggplot2 (and loving it so far!) I thought it would be fun to try and create some visuals to go with this claim.
I used one of Microsoft’s restaurant datasets and do a simple substring match on “subway”, returning the latitude and longitude. Using the following lines of ggplot and R code
states <- data.frame(map("state", plot=FALSE)[c("x","y")])
colnames(states) <- c("Lon","Lat")
ggplot(states, aes(x=Lon, y=Lat)) + geom_path() + geom_point(alpha=0.6,size=0.3,data=subway)
we get a cool picture showing all of the metropolitan areas of the United States.
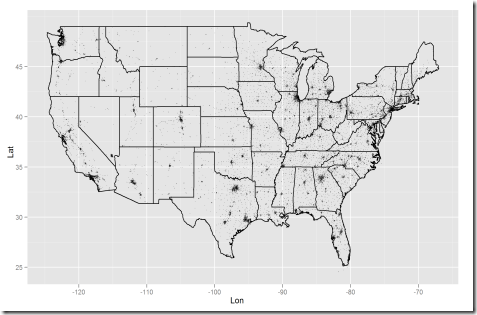
If you click on the image to zoom in you will be able to discern major highways as well. Subway is literally everywhere.